Doing sequential reads on a working set that is cached in the ARC should yield
the best case performance for reads in ZFS, as disk accesses are avoided. An
experiment like this can uncover CPU bottlenecks in the read codepath from the
moment the read is issued to the ARC access and back.
sequential_reads_arc_cached.ksh which is used to test for performance
regressions does exactly that.
An interesting detail of this test is that running it on a system that just booted, gives consistently better results the first time compared to subsequent times. On one of my test machines I’ve seen results of 10950 MB/s on the first run dropping to 8689 MB/s in subsequent runs. The reason is that, in the first run of the test in a fresh machine, the dbuf cache is being populated for the first time and there is no need to evict anything. This is unlike subsequent runs that need to evict entries from the dbuf cache in order to cache their dbufs.
While root-causing the issue with Matt and analyzing the flamegraphs from the different runs, I decided to take some notes and share them as I believe this information can be of value to others.
The Flamegraph
 Interactive version can be found [here](/img/flame/sequential_arc_cached_reads/stock-1m-64.svg).
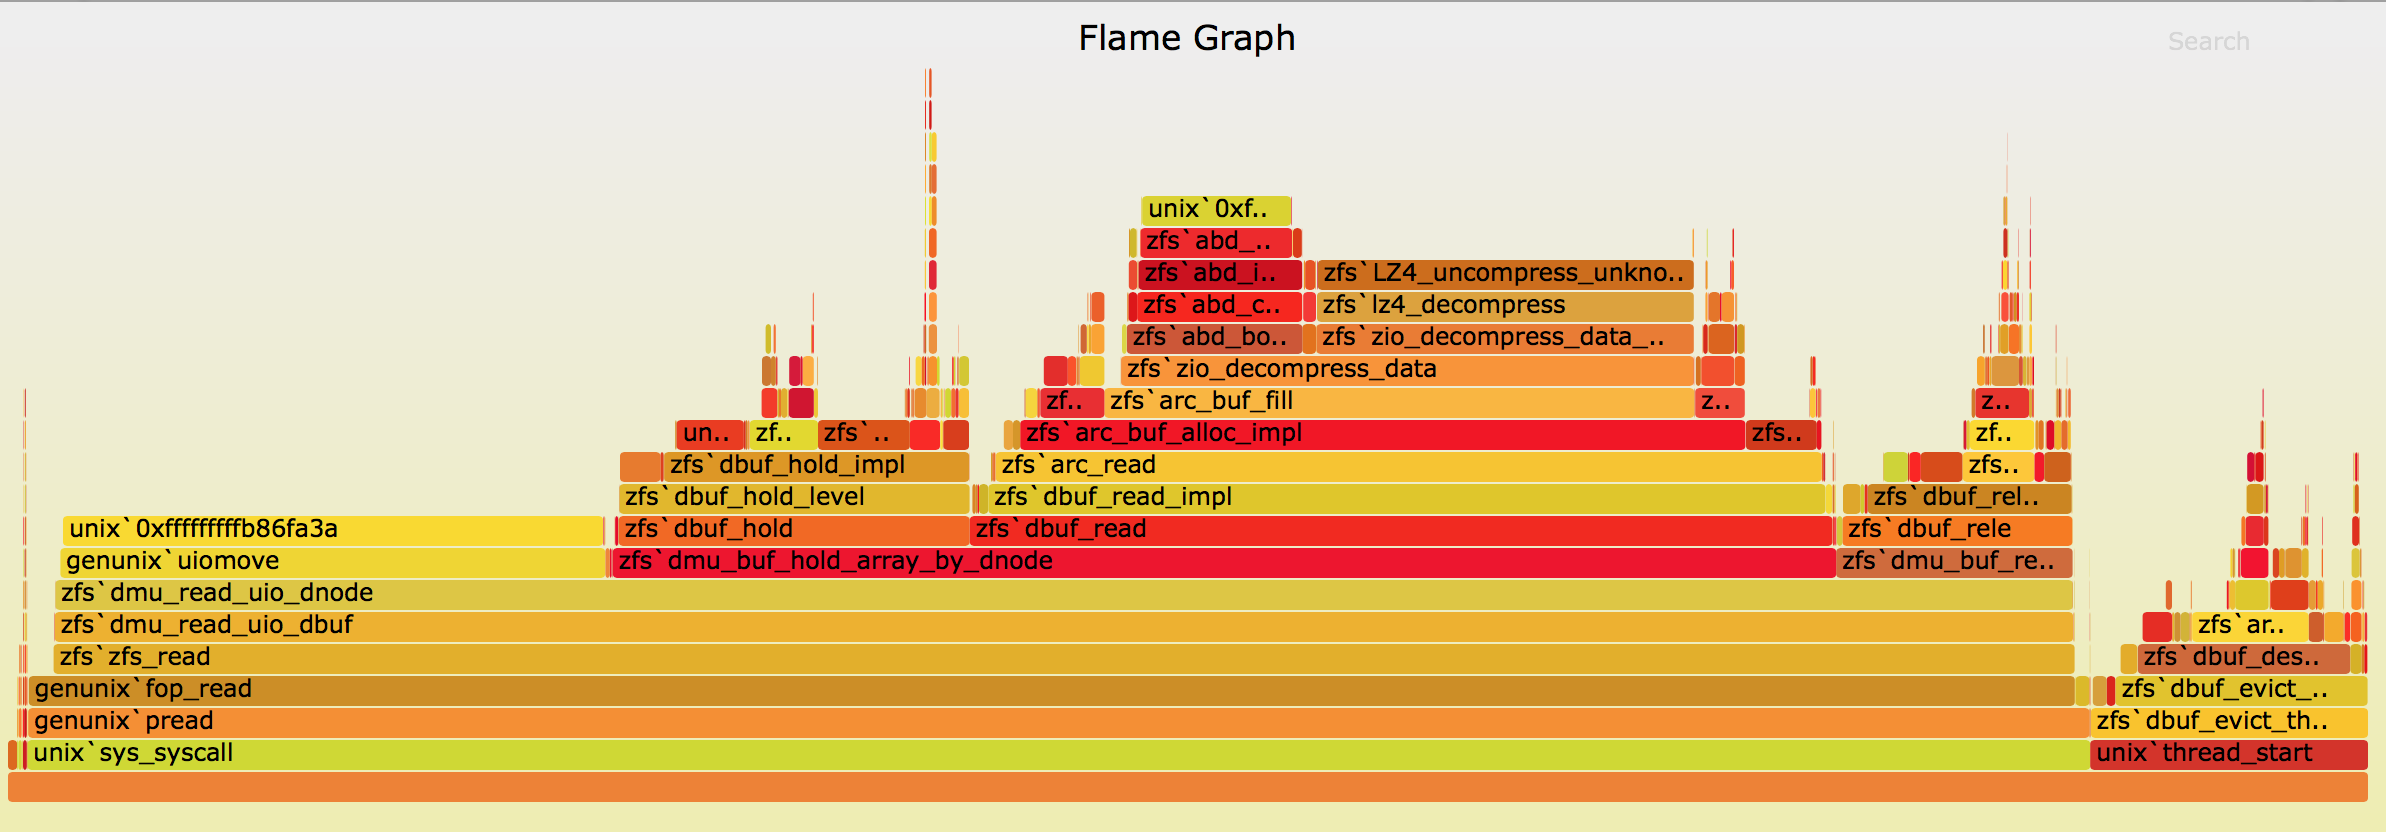
The bottom of the flamegraph indicates three things:
- The CPU is never idle.
- The majority of the time is spent in the read codepath.
- Some portion of the CPU time is spent on the dbuf-eviction thread. This part indicates how much time ZFS spends evicting dbufs.
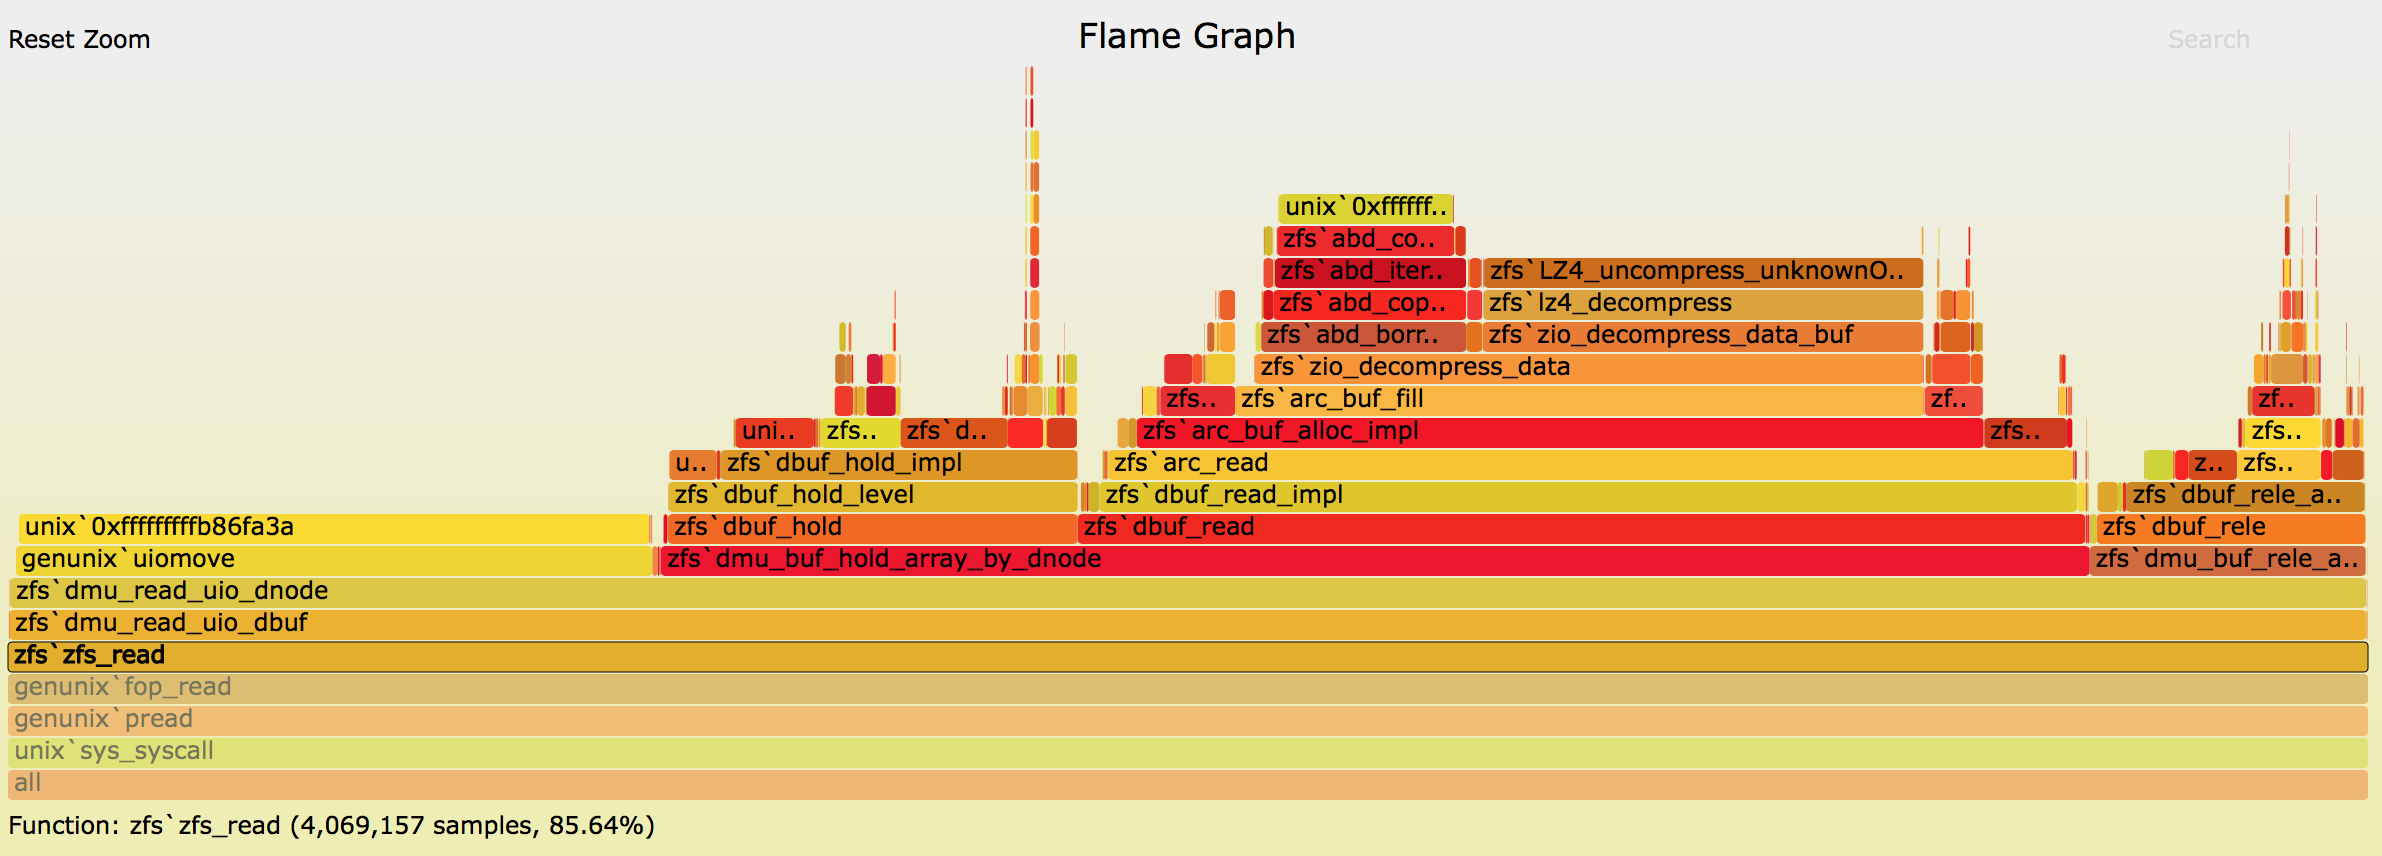
Under zfs_read() time is spent in three places. The majority of the time is
spent dmu_buf_hold_array_by_dnode() where we read the actual blocks from the
ARC. Then there is uiomove(), which copies the data read into buffers that
will be eventually returned to the userspace. uiomove() is a good indicator
of the work being done (the bigger the percent spent there, the more IOPS we
get in general). Finally, there is a small amount of time spent releasing the
buffers ZFS was holding.
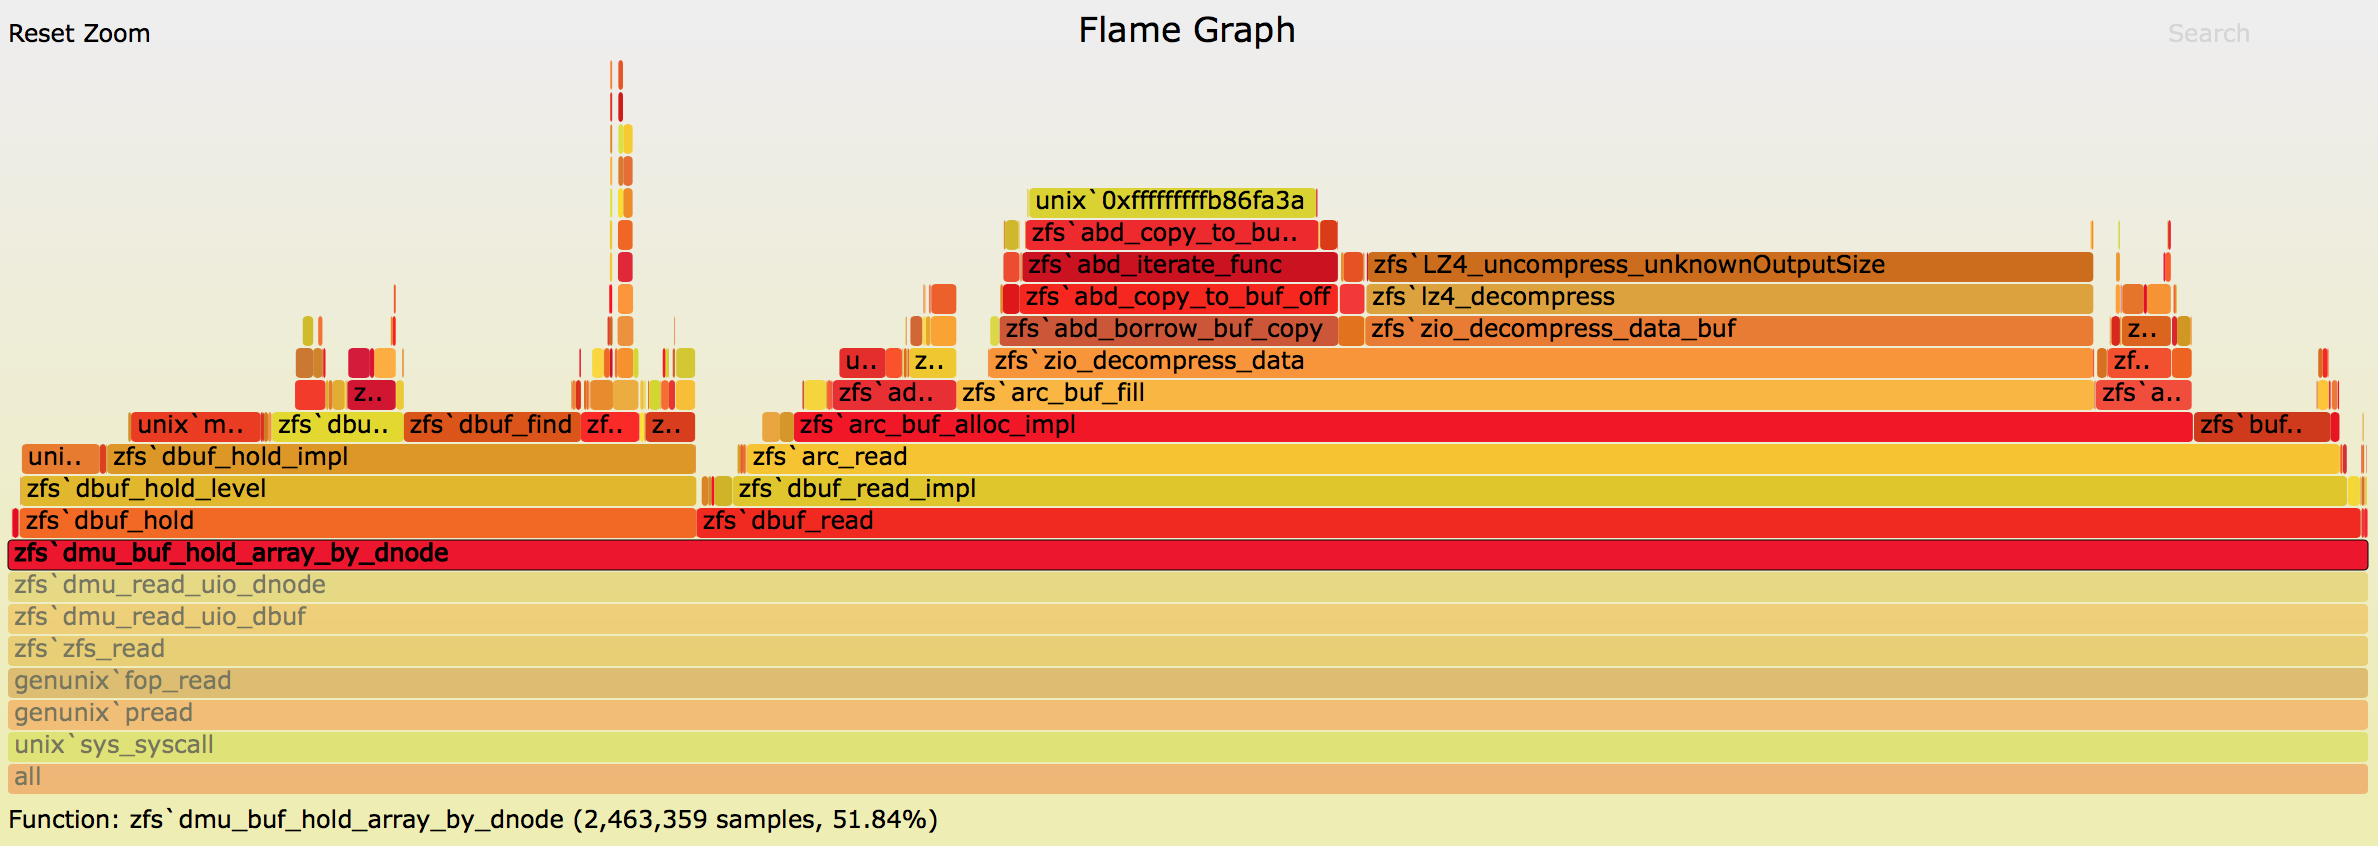
Inside dmu_buf_hold_array_by_dnode() there are two paths that call into
dbuf_read() to read buffers from the ARC. The one that is called directly
from dmu_buf_hold_array_by_dnode() gets the data that will be copied by
uiomove() to the buffers returned to the userspace. This is the data the
application that issued the read cares about.
The other path to dbuf_read() is through dbuf_hold(). In general, these
calls indicate time spent reading indirect blocks. Since the experiment
recorded by the flamegraph was doing only sequential reads, it is not
suprising that the amount spent reading indirect blocks is minimal.