~ Customer Issue
In a recent customer escalation we analyzed a system with major write imbalances among its zettacache drives. Specifically, most writes would hammer on one disk, out of the four, for a few minutes and then move on to some other disk to do the same. This resulted in the system not utilizing all of its available bandwidth and hurting overall performance of its zettacache data ingestion. Upon further investigation we discovered that their workload consisted almost exclusively of 8KB random writes. Random writes are a common workload for us as many of our customers use Delphix with standard relational databases. The size of those writes being 8KB consistently was unusual though because ZFS compression was enabled so we’d expect these block sizes to be distributed from ~2KB to ~7KB in practice. It turned out that these blocks wouldn’t compress well because the customer would encrypt them before they’d reach ZFS.
~ Reproducing The Problem
I was able to reproduce the issue in-house using an r5n_8xlarge instance on AWS. According to Amazon (1) these instances have 6,800Mbps (~850MB/s) of EBS bandwidth, so I used three 50GB gp3 low-perf volumes (2). Each of these disks would give me ~250MB/s; a total of ~750MB/s which is below the 850MB/s bandwidth limit. I created a ZFS dataset with 8K record size and disabled compression. I then ran a sequential randwritecomp (3) workload which was enough to reproduce the issue.*
Here is a graphical representation of the data ingested to the zettacache over
time for each disk (gathered with zcache iostat -ad 2 over the course of 30
mins):
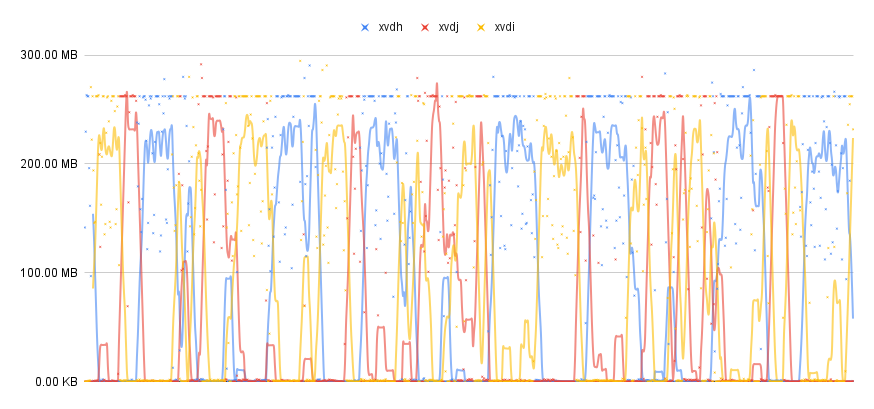
From the above graph it is easy to see that each disk takes turns maxing out its bandwidth with little or no work done by the other disks during that time. During that 30 min span, 218.54GB of data was ingested in the zettacache.
~ A Hypothesis
The customer’s workload being writes made Matt guess that the issue lied in the block allocation code nad upon further investigation he was right. In the block allocator, we segregate allocations by block size to allocation buckets. Within a bucket we have a set of slabs that we allocate from sorted by their free space (e.g. we first allocate from the most free slab, then we move to the next one, etc..). Here is the related code definitions:
#[derive(Clone, Copy, PartialEq, Eq, PartialOrd, Ord)]
struct SlabBucketEntry {
    allocated_space: u64,
    slab_id: SlabId,
}

struct SlabBucket {
    ...
    by_freeness: BTreeSet<SlabBucketEntry>,
    ...
}
Using Rust’s Ord trait in the derive macro above SlabBucketEntry, we
declare that entries are first sorted by allocated_space** and then by
slab_id. Interestingly slab IDs are naturally assigned by strictly
increasing order to device IDs that are also increasing in the same fashion;
e.g. device 0 contains slabs 0 to 99, device 1 contains slabs 100 to 149, etc..
(an exception to this rule are scenarios involving device expansions). This
means that if all slabs had the same amount of free space they would be sorted
by slab ID and by extension device ID. In turn this would mean that in the
beginning of each transaction, allocations would mostly happen from a specific
device untils its slabs fill up and we move to the next one.
~ Hypothesis Verification & The Workaround
Using zcachedb slabs (the equivalent of zdb -mmm for the ZettaCache) on my
system I was able to verify that our hypothesis was correct. I also verified
that this was the case in the customer’s system by looking at the support
bundle of the case. Since the block allocator doesn’t have any type of device
throttling nor other I/O balancing mechanism currently we decided on the
following two-line work around:
#[derive(Clone, Copy, PartialEq, Eq, PartialOrd, Ord)]
struct SlabBucketEntry {
    allocated_space: u64,

+    // This field is added to randomize the order of slabs that have the same amount of allocated
+    // space within a bucket. Without this field, slabs may end up being sorted by slab ID which
+    // in most cases means sorted by device ID. This could lead to issues like I/O imbalances
+    // between multiple disks that can affect performance.
+    discriminant: u16,

    slab_id: SlabId,
}
...

    fn to_slab_bucket_entry(&self) -> SlabBucketEntry {
        SlabBucketEntry {
            allocated_space: self.allocated_space(),
+            discriminant: thread_rng().gen(),
            slab_id: self.id,
        }
    }
In the unfortunate case that the above diff didn’t make it clear, we ended up adding a discriminant to the struct; an extra field with a random value that will randomize the order of the slabs. Here is the same graphical representation from earlier after rerunning my experiment with the new code:
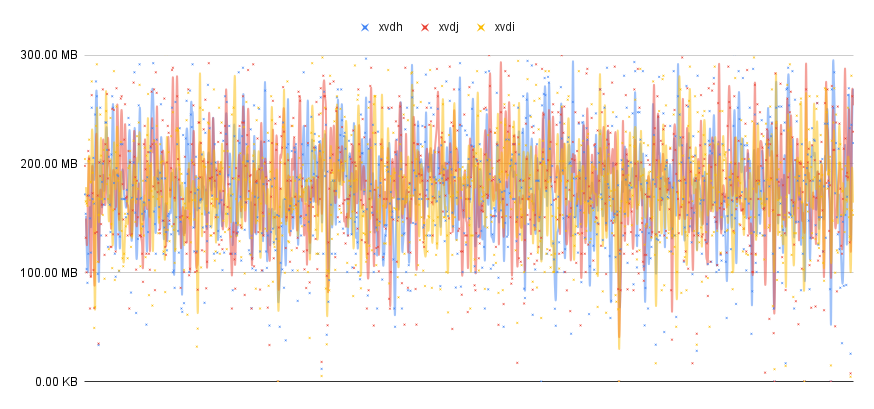
We now see that the situation is resolved with all the disks satisfying I/O request at all times. During the last 30 mins of this experiment 480GB of data were ingested in the zettacache. That’s a 2.2x speedup for zettacache ingestion with 3 disks.
~ Appendix: Notes
* In reality, I also had to set the following tunables because my cache would have almost no space left and we’d drop allocations until a checkpoint would come and free up space:
$ cat settings.toml
checkpoint_interval = "5 seconds"
target_free_blocks_pct = 20.0
** Sorting by allocated_space (from min to max) is the same as sorting by
free_space (max to min) as all slabs are equally sized with a constant total
space and total space = allocated_space + free_space.